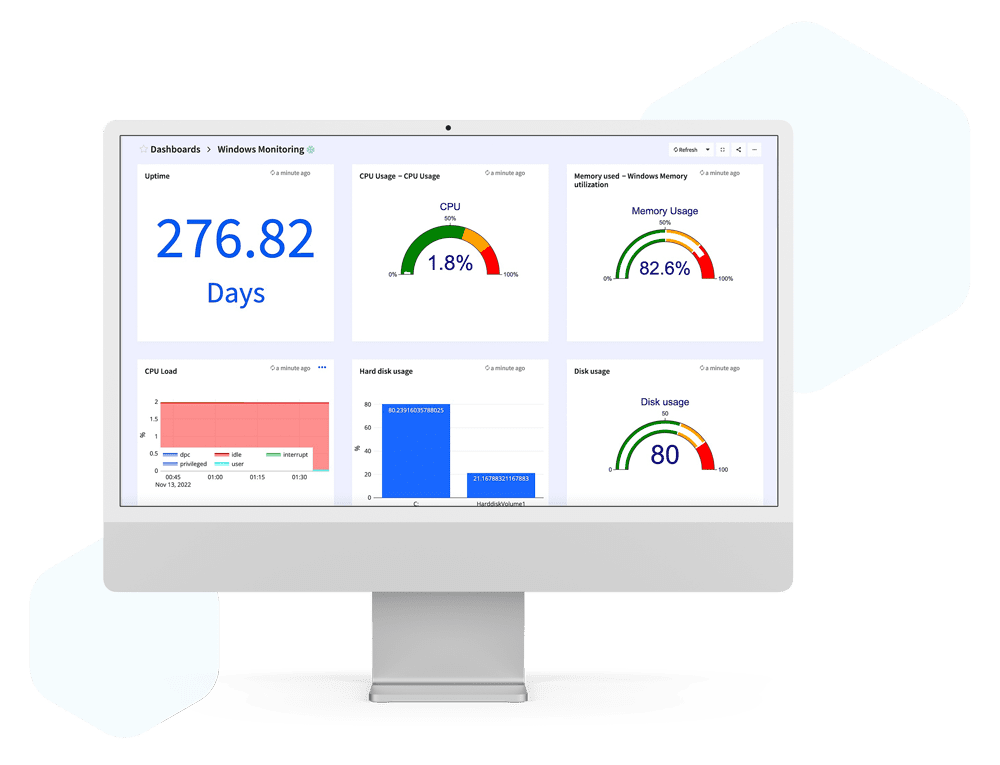
Real-Time
Monitoring

Monitoring without any limits – ABSOLUTELY FREE!

Experience the power of Prometheus, Grafana imports and powerful AI/ML-based anomaly detection.

More insights. ZERO COST. Less hassle.

problem

Is your monitoring stack setting you back ?

Monitoring
Silos

Are monitoring silos hindering comprehensive visibility into your applications and infrastructure?

Superficial
Insights

Do superficial insights prevent effective decision-making and optimization?
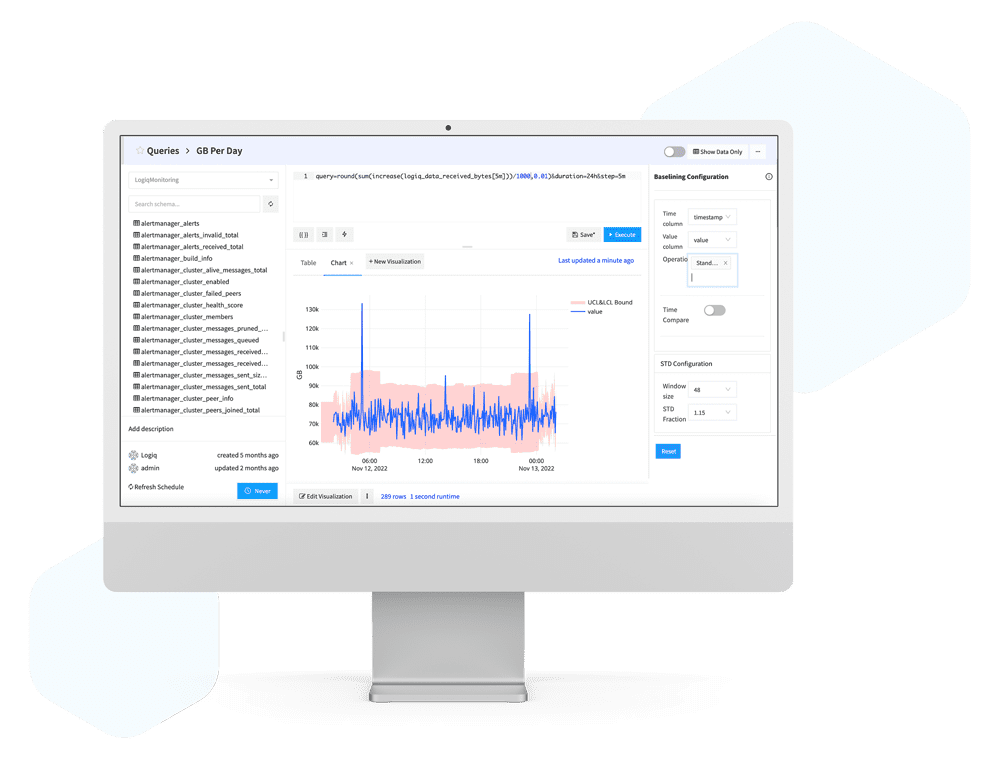
Inaccurate
Correlations

How do you tackle inaccurate correlations in your performance metrics?
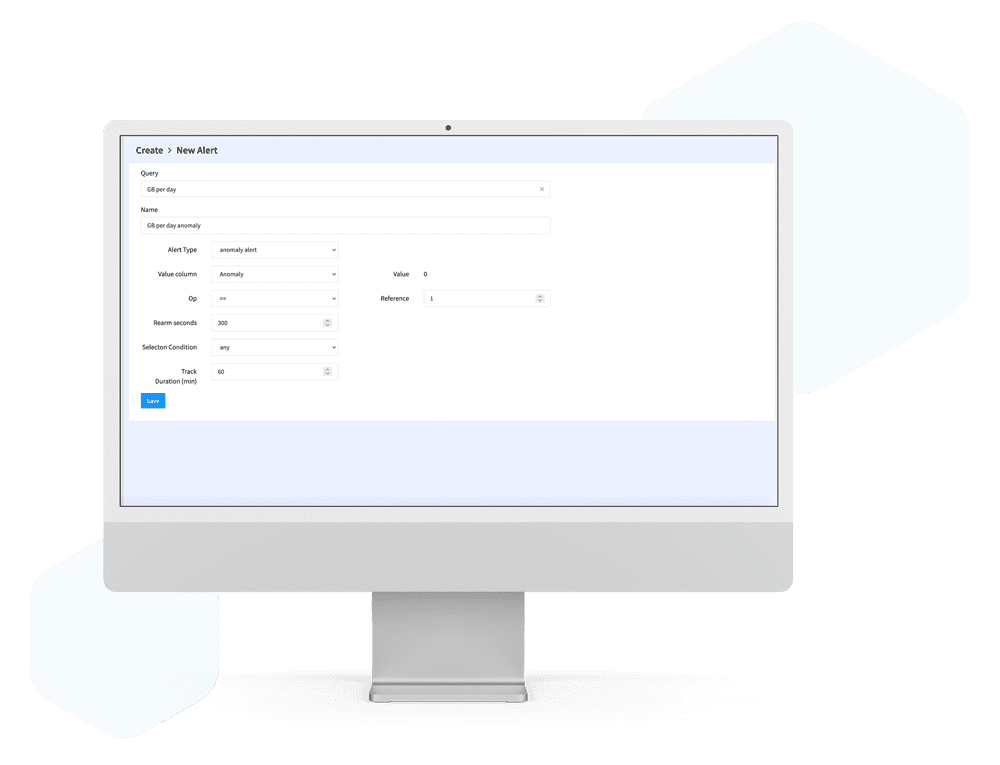
Alert
Spam

Are you overwhelmed by alert spam, causing difficulty in prioritizing issues?

Reactive
Approach

Is a reactive approach affecting your system's stability and performance?

BENEFITS

Real-Time Monitoring Can Help.
See How.

Prometheus monitoring
– always free!

Free AI/ML based anomaly detection and forecasting
Enterprise-grade monitoring
Connect unlimited Prometheus instances
Scale and use on any object store
Directly import Grafana dashboards
Visualize with 100s of ready-to-use integrations

FEATURES

Controls In Your Hands

Powerful Querying

Uncover fine-grained data and metrics from logs using queries built with metrics, label filters, operators, custom parameters, and PromQL-compatible functions.

Fortify Data and Data Sources

Secure and govern access to your data and data sources using your existing identity and authentication groups and rules.

Monitoring dashboards

See everything across your applications and infrastructure through full-customizable and flexible dashboards that are updated in real-time.

Share and embed

Share your monitoring dashboards with read-only access using shareable URLs. Embed existing query visualization widgets anywhere you please.

Choose Your Visualization

Unleash your creativity while visualizing your data. Choose from a wide variety of charts, graphs, and faceted search views that best bring out the insights in your data.

Powerful alerting

Apica’s alerting can be configured to alert on anomalies to reduce alert noise. Create alerts directly from PromQL query results without depending on alertmanager. Send alerts to multiple destinations, including E-Mail, custom alert endpoints, PagerDuty, Slack, and OpsGenie.

Additional data sources

Plug in all your data sources across all your applications and infrastructure into a single platform using a combination of built-in connectors and your existing aggregators and forwarders.

Hybrid data source visualizations

Visualize data from multiple data sources into the same dashboard and create holistic, interoperable, co-related views of your data for faster insights.

Apicahub App Store

Install readymade monitoring dashboards for popular applications. That’s not all, contribute dashboards for your applications to Apicahub. It’s an open source repository available for FREE for use with Apica. See below, some of our popular application dashboards.

Request demo apica

Leaving without a Demo?

Discover the power of Active Observability with Apica

Unlock the full potential of your data and cloud infrastructure with a personalized demo of Apica. See firsthand how our Apica Ascent platform can transform your data observability strategy, ensure scalability, flexibility, and deliver precision in every aspect of your operations.